Track event and storage consumption through Dadosfera’s Event and Storage Consumption Dashboard. In this guide, the main topics are:
- Why use the Event and Storage Consumption Dashboard?
- How do you access the Event and Storage Consumption Dashboard?
- How do you use the dashboard?
1. Why use the Event and Storage Consumption Dashboard?
Our Event and Storage Consumption Dashboard was designed to provide a detailed view of monthly storage and event usage. It allows you to:
- Monitor costs: Check whether your monthly event and storage consumption stays within the expected and contracted limits.
- Analyze growth: Identify trends in event and storage volume over time.
- Plan ahead: Estimate and anticipate future event and storage usage needs.
2. How to access the Event and Storage Consumption Dashboard
To access the dashboard, follow these steps:
Open the Dadosfera app at https://app.dadosfera.ai/ and sign in with your username and password. Click your user in the upper-right corner and select My Organization, as shown below:
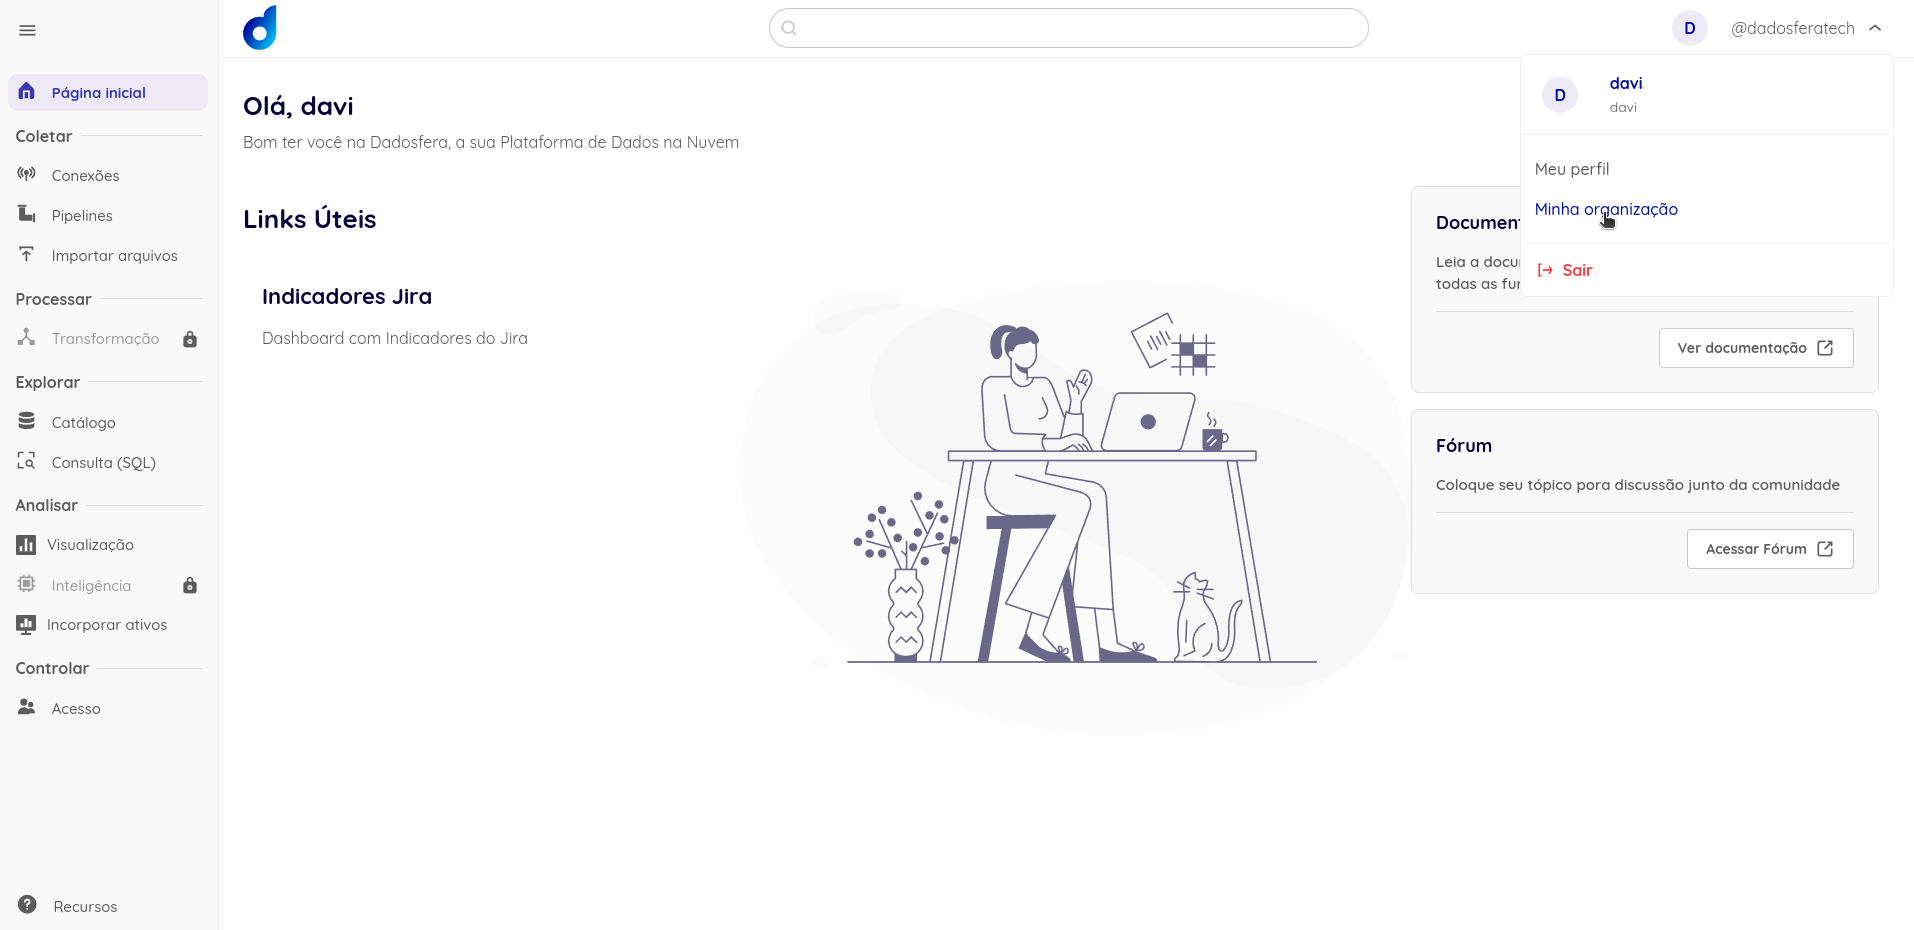
Then scroll down to Monitoring to find your organization’s Event and Storage Consumption Dashboard.
3. How to use the Event and Storage Consumption Dashboard
The dashboard is organized as follows: event data appears on the left side and storage data appears on the right side. At the top, filters allow you to update the visualizations. The most important ones are:
- Year filter: Select one or more years to filter event and storage data by year.
- Month filter: Select one or more months to filter event and storage data by month.
For example, if you filter by year 2024 and month December, the filters look like this:

The charts update automatically. If you also want to include November, just open the month filter and add it. The filters will look like this:

If you have any questions, contact Dadosfera Support.