Version 1.7.1 | January 2025
Check out the latest Dadosfera updates and discover what we have prepared for you! 🚀
New features
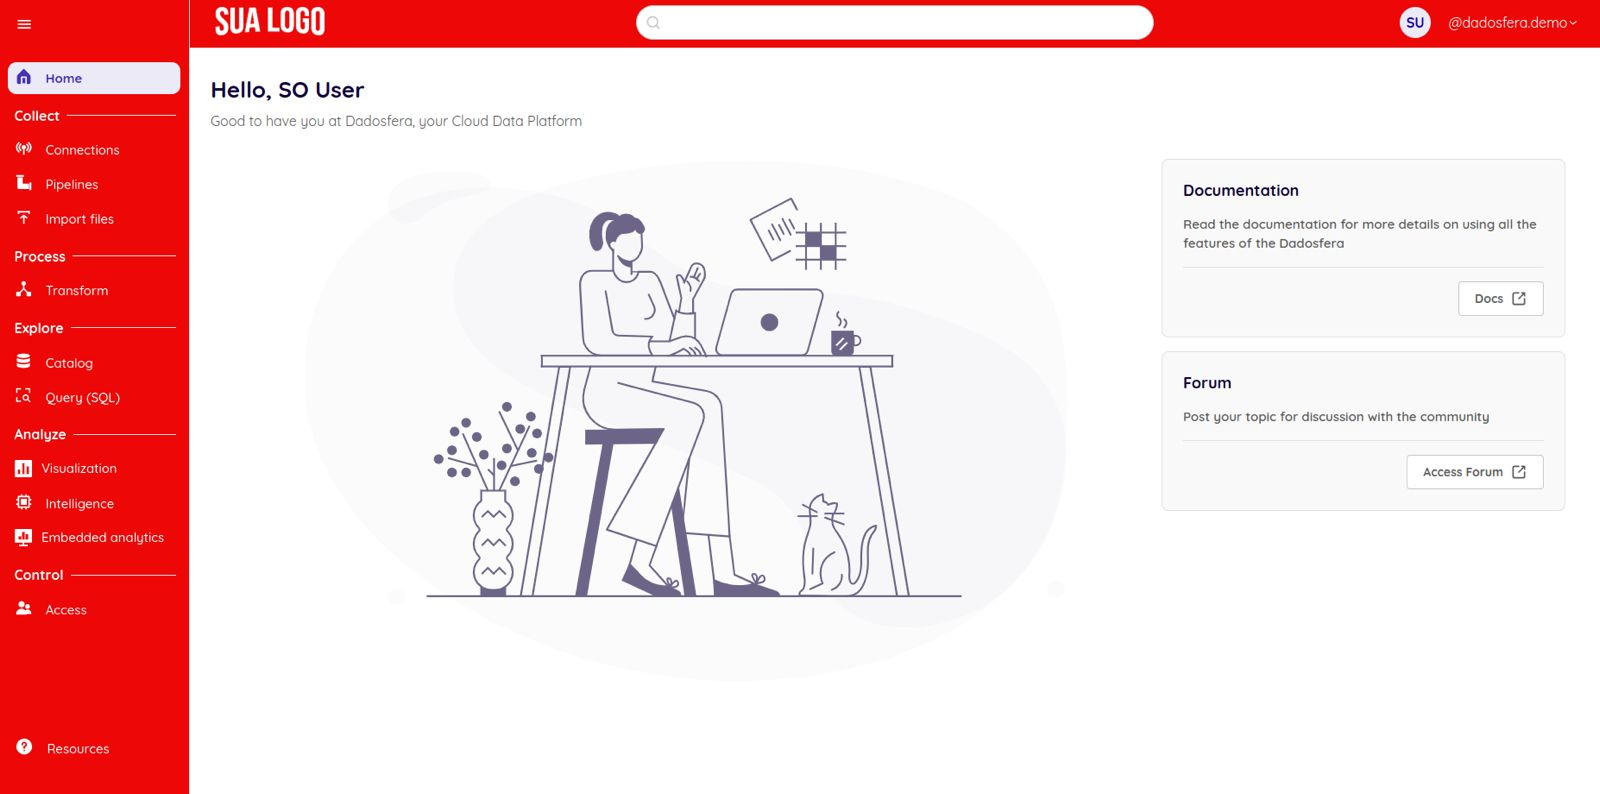
Platform customization (White Label)
The new Platform Customization (White Label) feature lets users with super admin permissions adjust the platform's visual identity to reflect their organization's brand. You can customize the logo, colors, fonts and other graphic elements to create an experience aligned with your corporate identity.
This customization lets companies integrate the platform more smoothly into their ecosystem, maintaining consistent visual communication and reinforcing their brand in daily use.
Platform Customization will be available to Dadosfera customers according to their subscription plans and contracted features. For questions, contact our CS team at cs@dadosfera.ai.
New pipeline and Intelligence/Processing job monitoring screen
The new screen provides an overview of all jobs and pipelines in the module for complete activity tracking. To access it, add /app-analytics to the end of the URL. For example, if your URL is https://app-process.dadosfera.ai/ , use https://app-process.dadosfera.ai/app-analytics . 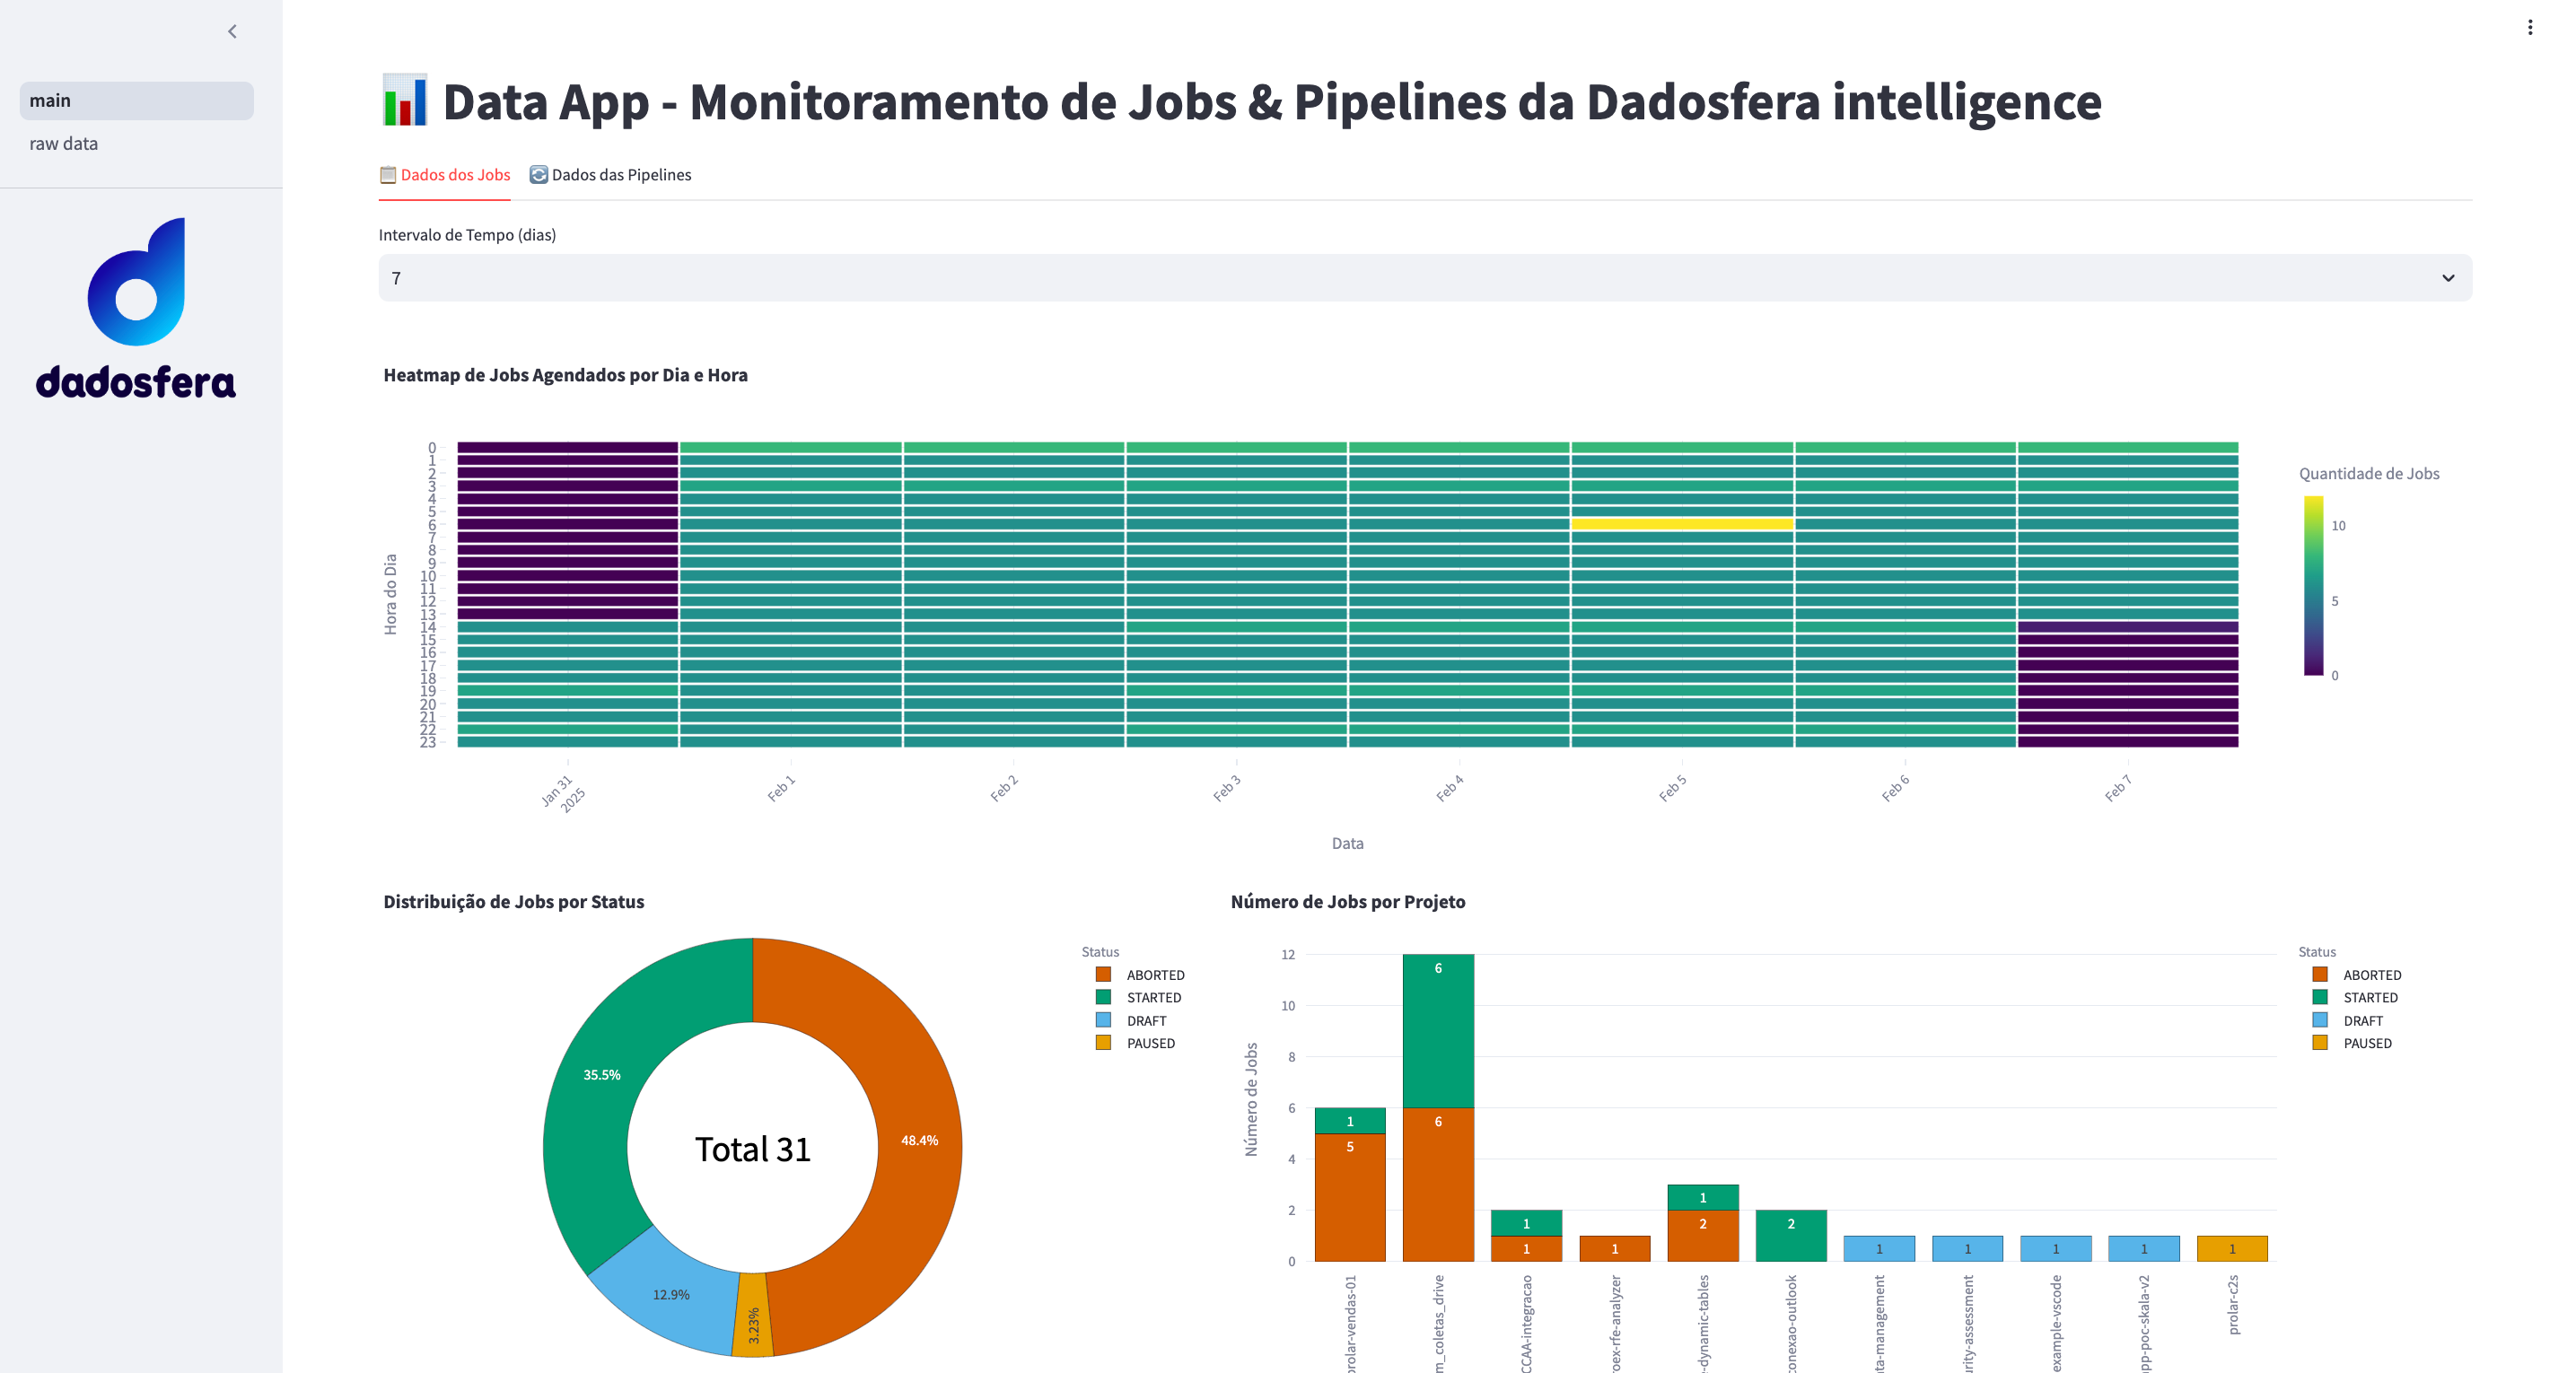
Kubernetes Dashboard in the Intelligence/Processing Module
The Intelligence and Processing Modules run on a technology called Kubernetes (http://kubernetes.io/). Existing features such as Jobs, Jupyter Notebooks, Data Apps and Environments primarily run using Pods. Each runs in one or more pods, identifiable by the IDs in the URL. In this dashboard, you can track CPU and memory consumption per pod and node, identify pods with high usage or errors, and analyze logs and events for debugging. You can also evaluate storage usage, identify pipeline bottlenecks and check scheduling failures. The Kubernetes Dashboard will be available to Dadosfera customers according to their subscription plans and contracted features. For questions, contact our CS team at cs@dadosfera.ai. 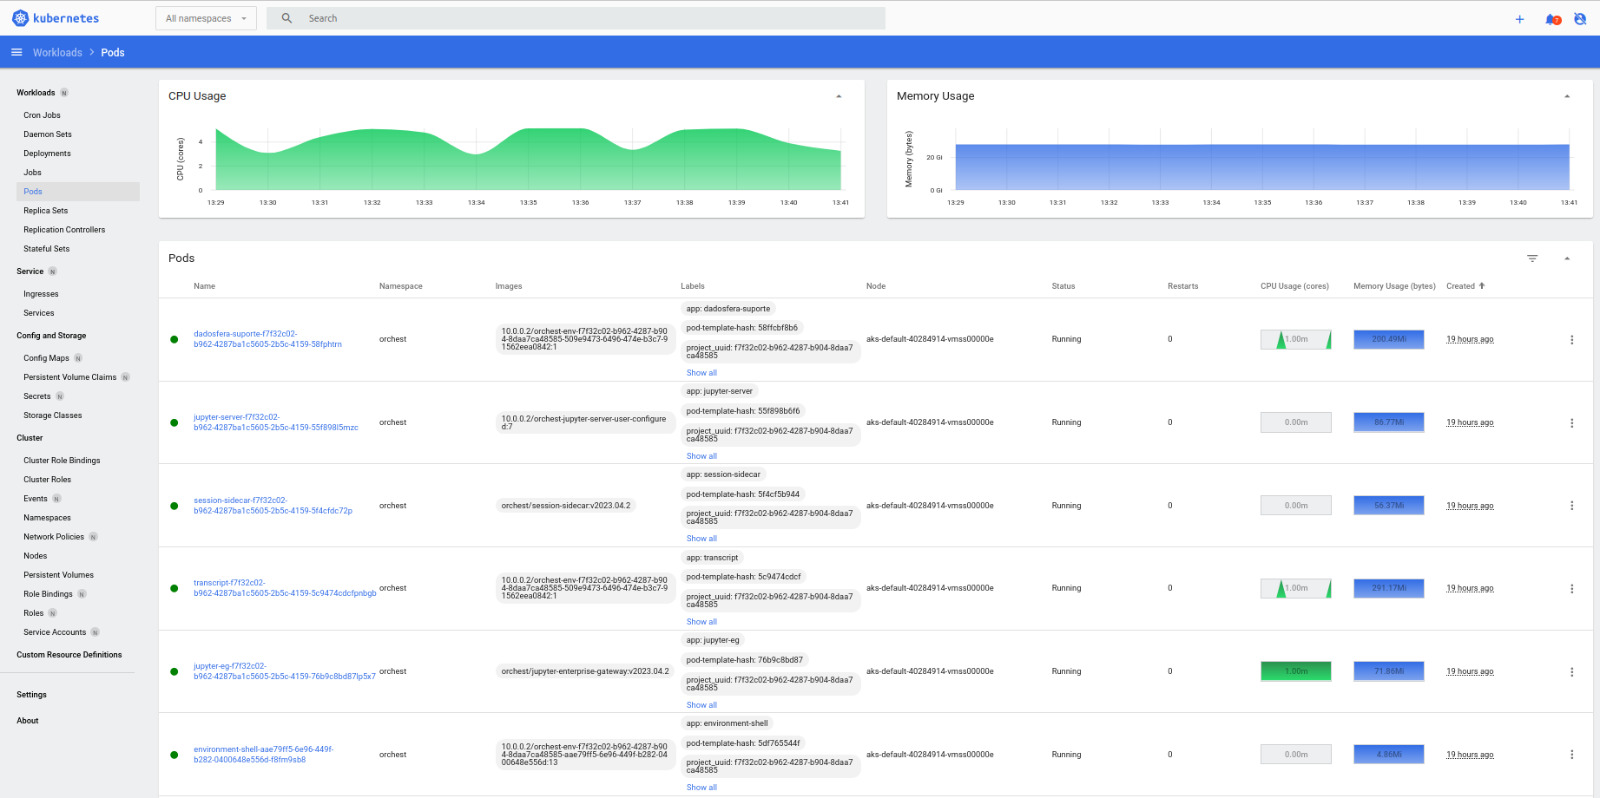
✅ Improvements
Collection pipeline monitoring screen — Version 2.0
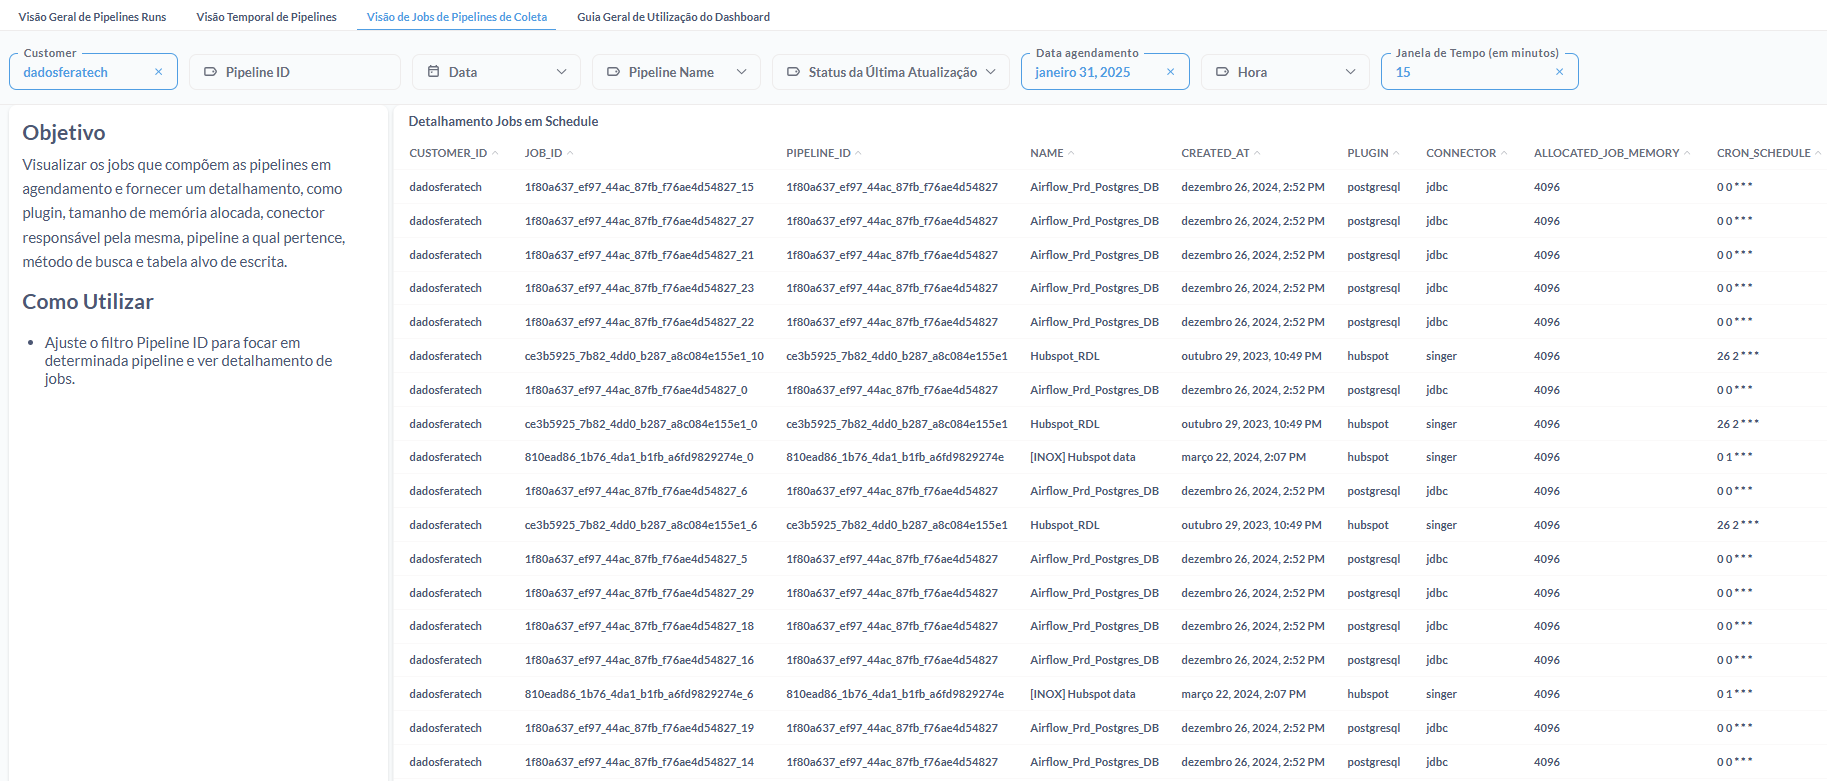
The Collection Pipeline Monitoring V2.0 screen provides a detailed view of execution status and history for complete activity tracking. To access it, open the Collection Module, go to 'Pipelines' and click 'Monitoring'.
The dashboard now includes new features to improve pipeline analysis and monitoring:
- The new Timeline View tab provides detailed analysis of schedules and execution distribution over time, making planning easier and helping prevent bottlenecks.
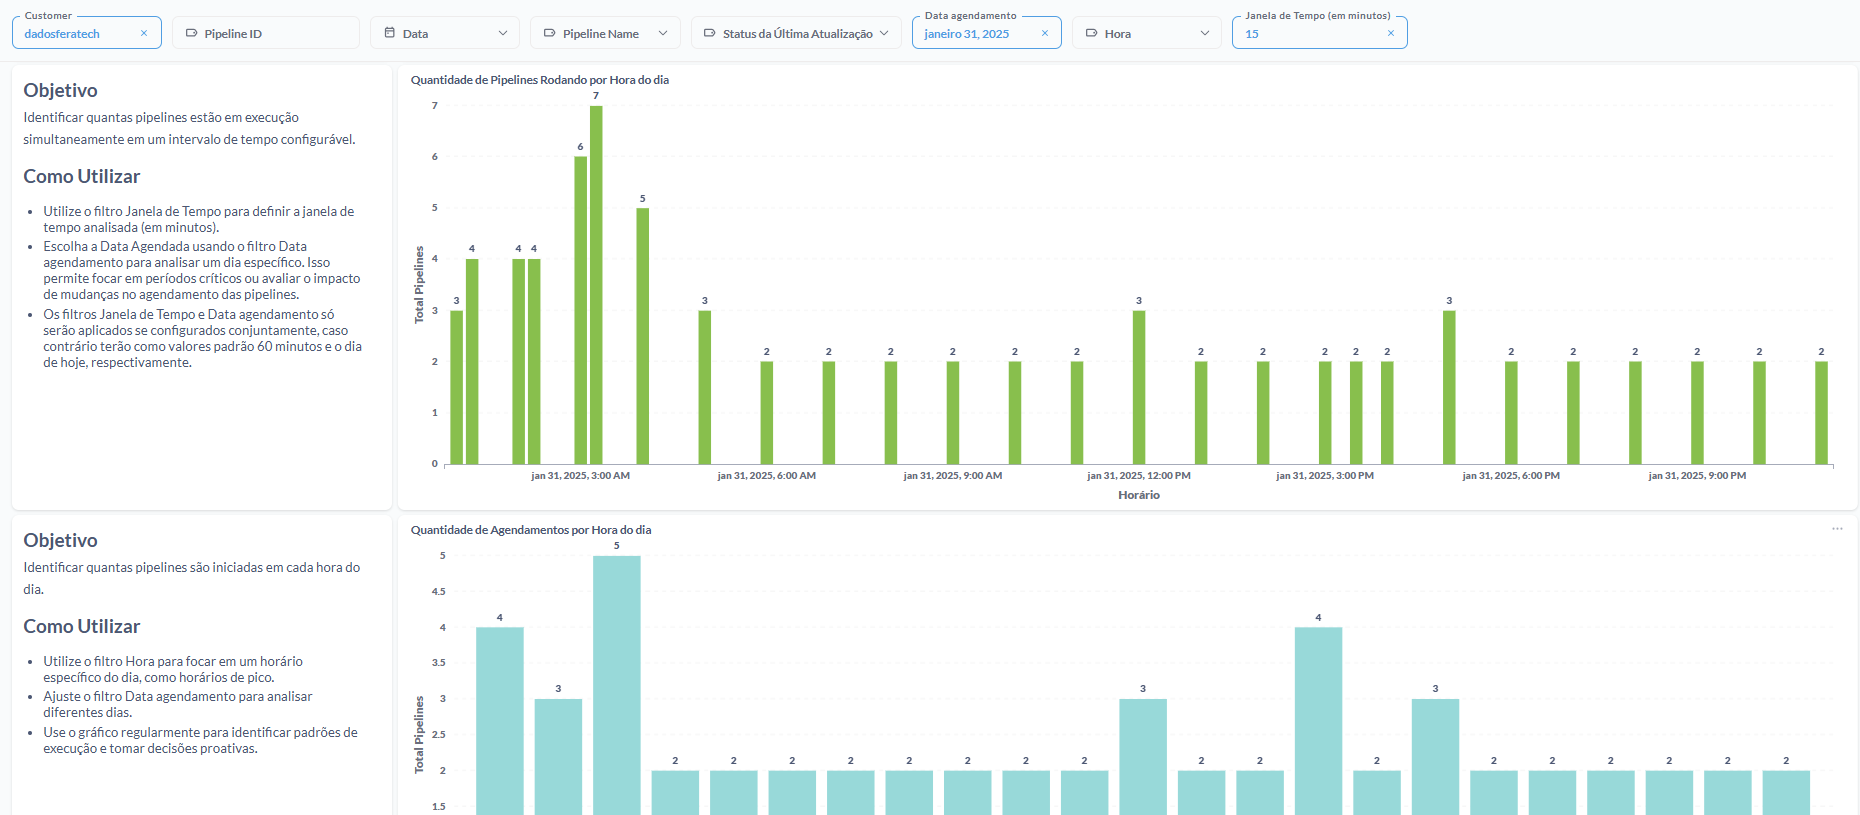
- The Job Details tab supports granular monitoring with detailed technical metrics for greater control and resource optimization.
- A new Documentation tab provides explanatory guides, practical examples and tips, making onboarding more intuitive and improving the dashboard user experience.
Other improvements
- Visual refinements in the Processing and Intelligence Modules for a more intuitive experience.
- Priority Class implementation ensures that Orchestrator core pods take priority over DataApps, Jupyter and other pods, improving environment stability.
- Fixed Environment Shell instability for more reliable operation.
Thank you for being part of the Dadosfera community!